This report explains how The Life You Can Save performed on its key metrics in 2015 and provides a discussion of our impact as an organization. We’re proud of our accomplishments over the year, particularly the progress we saw in the most important areas we use to track our performance.
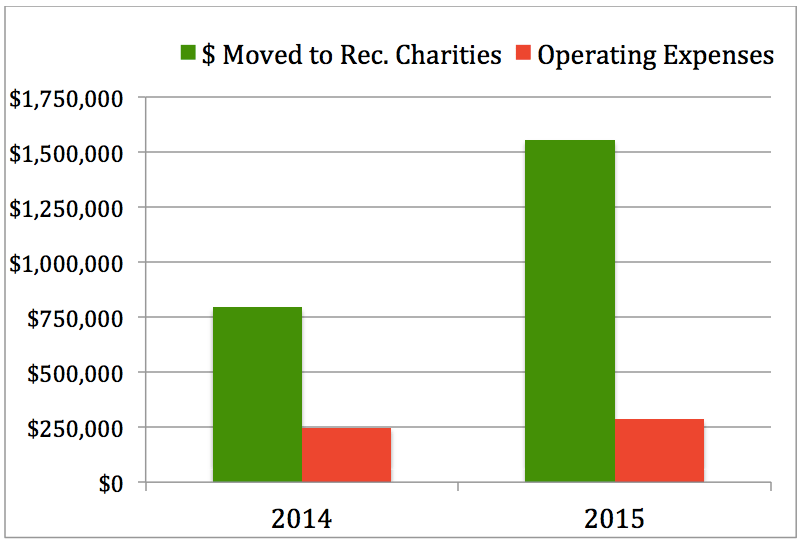
- We conservatively estimate that we moved $1.55 million to our recommended charities in 2015, about double our 2014 impact.
- Web traffic increased significantly, rising almost 80% from the previous year.
- We’ve continued making investments in online content and philanthropy education that we expect to pay long-term benefits.
Money Moved
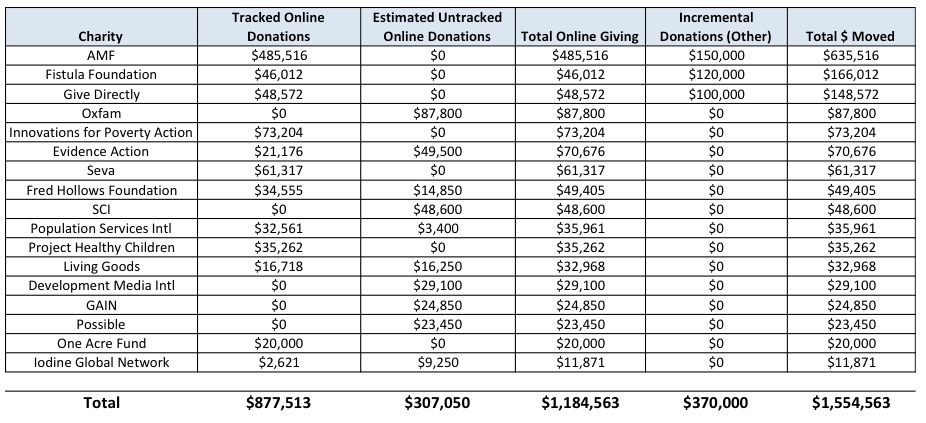
In 2015 we moved $1.55 million to our recommended charities. This is a conservative estimate, and perhaps an extremely conservative one–as discussed in the Offline Donations section below, our true impact could have been several million dollars greater. Our operating expenses were ~$280,000 meaning we conservatively moved ~$5.5 to outstanding charities for each dollar we spent.
Online Giving
Our recommended charities received $1.2 million in online donations that we influenced in 2015, ~75% of which we can track directly.[1] The Against Malaria Foundation received a much larger share than any other charity, accounting for over 40% of our online money moved.
Offline Giving
Over the second half of 2015, The Life You Can Save had a series of conversations with members of a wealthy family. In addition to these discussions, we connected the family with the heads of several of our recommended charities to allow them to build a deeper relationship. Ultimately, the family donated $3 million to AMF, $2 million to Give Directly, as well as a smaller gift to support The Life You Can Save’s operating expenses.
We’re not quite sure how to account for these gifts in our money moved calculations. Both the family and the charities have told us we should count this money in our metrics. But in the context of our broader discussions with the family, we’re fairly confident that most of this money would have ended up in the hands of effective charities even if we weren’t around. Internally, our sense is that our role increased the probability of these donations being made by 0-10%, so we’ve given ourselves credit for 5% of the total in our estimates. Rather than trying to estimate our influence more precisely, we’re keeping our focus on developing this relationship to the point where significantly more money is given to fight extreme poverty down the line.
In October, The Life You Can Save also helped organize a concert to benefit Fistula Foundation performed by legendary musician Paul Simon. This event raised $150,000, and we believe $120,000 is incremental money that would not have otherwise been donated.
Money Moved Details
For a full breakdown of our money moved in 2015, please see the table below:
We understand that there are reasons why these numbers may be overstating, or understating, our impact. The primary reasons are laid out below for clarity. Weighing these factors against each other, we believe our estimates to be conservative.
Reasons we may be overestimating our impact
- People who gave through our site might have given to effective charities through other means if our site were not available.
- Some of our influence is no doubt due to work Peter has done/is doing rather than due to The Life You Can Save as an organization.
- Our money-moved totals don’t distinguish between our recommended charities. This could be misleading if one assumes there are significant quality differences across charities.
Reasons we may be underestimating our impact
- Our numbers don’t capture all the donations we influence. We’re primarily capturing donations from people who donate on a charity’s site after being referred there from our site. For some charities, we also track donations made on their site from users who indicate that they heard about the charity from us. Our charities regularly report that they believe the donations they measure understate our actual influence. Examples of donations we’re missing: people who donate directly on a charity’s site but don’t self- report where they heard about the charity; people who donate through other platforms (e.g. GiveWell, donor advised funds, Charity Science, etc.); donors who are motivated to give after seeing a charity share our recommendation on social media, etc.
- We’re not counting any future donations, only donations that have actually been made. So our figures don’t assign any value to someone taking our pledge, donations we expect Giving Games participants to make in the future, or donations that develop from relationships we’re currently cultivating.
- We’re not including any money we influenced to outstanding charities outside our recommended list.
- When estimates are required, we’ve tried to be conservative.
Web Traffic
Our web traffic showed strong growth in 2015, increasing by almost 80%. We had over 380,000 sessions over the year, about as many as we had in 2012-2014 combined.
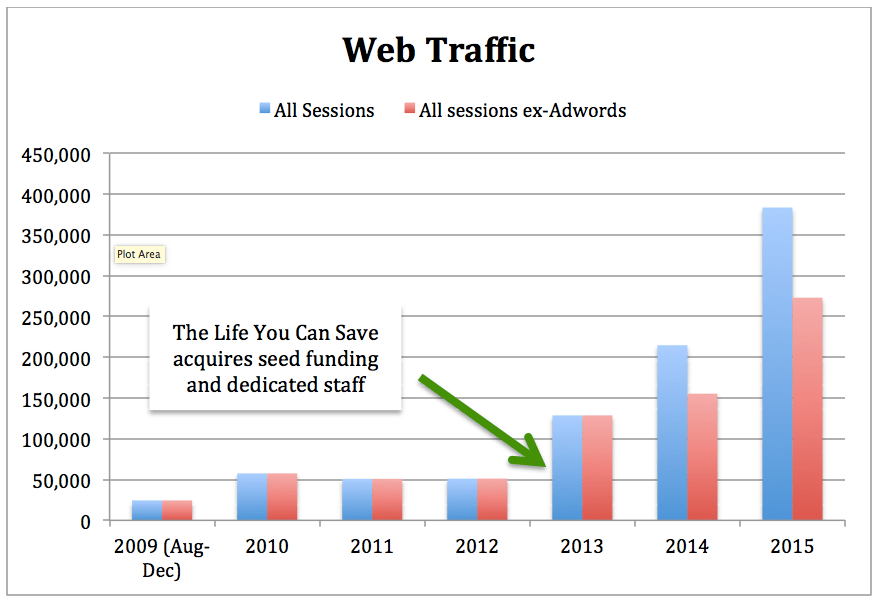
This growth was driven by organic search traffic. This segment grew by over 90% in 2015. Performance was particularly strong around the spring publication of Peter Singer’s latest book The Most Good You Can Do , which provided a tailwind to our efforts this year.
We also saw significant growth in the traffic we get from the free adwords Google provides non-profits. In October, we qualified for a program that quadrupled our budget. While this is a one-off increase, implementing the expanded budget for all of 2016 will allow us to reach over 200,000 visitors through the AdWords program.
Web Content
People who visited our website last year had a vastly different user experience than previous visitors. We invested in creating and refining our content to engage our users and communicate our message in a more compelling way.
We got the year off to an early start by releasing our interactive Impact Calculator in January. This tool helps users easily grasp how much their giving can accomplish by showing them what each of our recommended charities can do with a given size donation. Not only is the Impact Calculator helping us attract new donors on our own site, we’re also sharing the underlying code with other effective giving groups to help further their work. It’s also proving to be a media-friendly tool, with recent mentions in articles on Bloomberg and Gawker.
Later in the year, we released write-ups on each of the cause areas our recommended charities work in. This new content helps us attract new users to our site, while making it easier for our audience to understand the work our charities do.
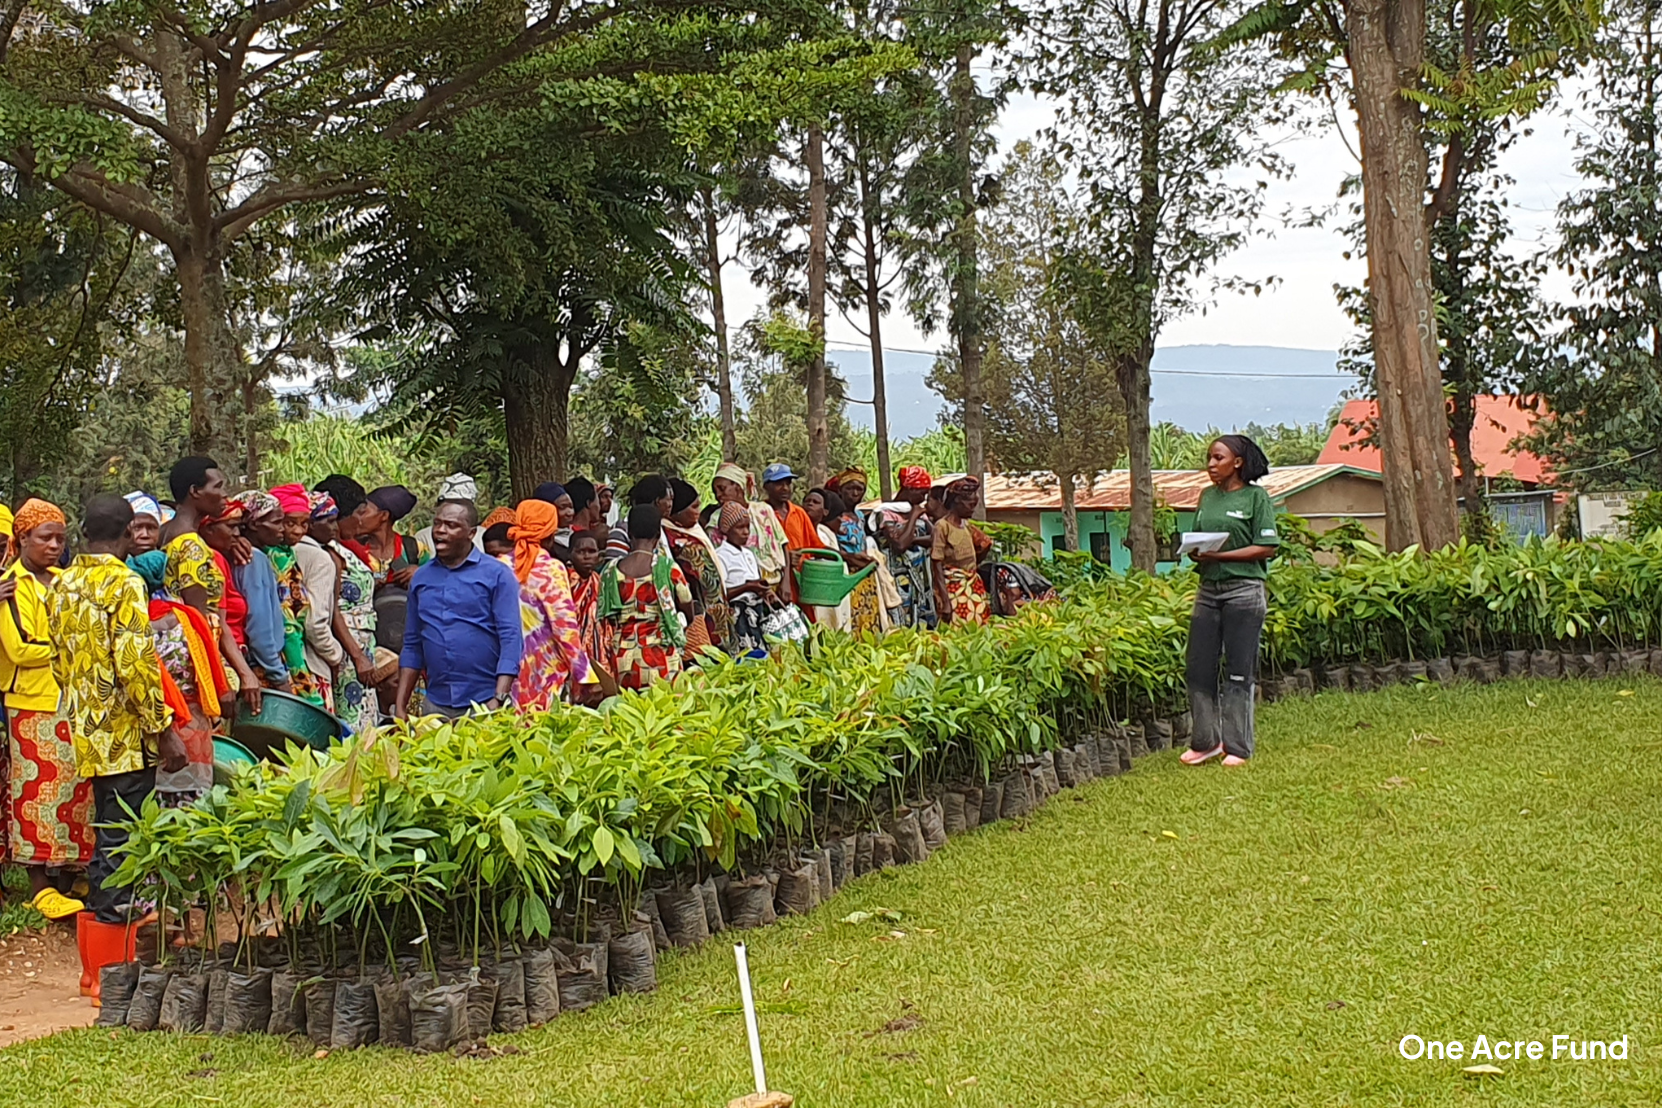
Another important addition came toward the end of the year, when we added One Acre Fund to our recommended list. We’ve received regular requests for broader recommendations in the hunger and agriculture areas. We’re excited to highlight One Acre Fund, the impact they have on the lives of farmers and their families who live on less than 70 cents (US) per day, and their commitment to evidence-backed programs.
Besides the new content described above, we also refined the look and feel of other important parts of our website. We redesigned our homepage to create a cleaner user experience and easier navigation. We also overhauled the write-ups we provide about each of our charities, standardizing their format and significantly improving their visual aesthetic.
Giving Games
2015 marked the year that Giving Games became established as one of the most widespread, and one of the fastest growing, philanthropy education programs in existence. We’re now running Giving Games in over a dozen countries, having expanded into Germany, France, China, Norway, and Sweden over the last year. While word of mouth has driven much of this growth, we’re also highly optimistic about the potential to grow through partnerships such as our recent collaboration with Intentional Insights to run Giving Games throughout skeptic and secular communities.
In addition to our rapid growth (discussed in detail in our Giving Game metrics report), we’ve also made important progress in building out the infrastructure to support future growth and make each Giving Game as impactful as possible. Our improved resource library makes it easy for anyone- educators, groups, individuals, and companies- to run a Giving Game. And we’ve sped up and standardized our data collection process, to help us learn from experience as efficiently as possible, with a focus on learning how to improve post-game solicitations and follow-up to add to the evidence we have that Giving Games promote better giving behavior.
Discussion
We’re glad to see our “multiplier”, the ratio of our money moved to our expenses, has risen to 5.5 from 3.2 in 2014. In many ways this is our most important metric. If we aren’t raising more money for effective charities than we spend, there’s no reason for us to exist.
We do want to caution, however, against interpreting our multiple too literally as a measure of the impact of our work. As discussed above, our estimates of money moved are subject to measurement imprecision and uncertainty about counterfactual giving. And even more importantly, measuring a multiple on an annual basis suggests that the payoff from our work is all confined to the year in which it occurs. In reality, our expenses are often front-loaded. Projects like the Impact Calculator and Cause pages produce content that will have lasting impact. Similarly, relationships with high net worth donors can take years to cultivate. So when we form strategy and prioritize projects, our goal isn’t just to maximize that year’s multiplier. We’re more than willing to make investments that will pay off in higher donations over the long-term.
Big picture assessment
When we take stock of our situation as we enter 2016, we’re optimistic about our position and the opportunities that lay ahead of us. The Life You Can Save’s message has a proven track record of inspiring people to join the fight against extreme poverty. And since 2013 when The Life You Can Save acquired a dedicated staff and became a registered charity, we’ve been able to break out of the plateau that had occurred in the absence of a team and spread that message to more people than ever before.
Ultimately our success will hinge on our ability to make progress in three areas: reaching more people, converting people we reach into donors, and raising the average gift size per donor. We’re in a better position than ever to make strides on all three fronts.
To expand our reach, we’re continuing with the web strategies that have driven our growth in organic traffic. And we’re also pursuing partnerships that will get our content and charity recommendations in front of new audiences, such as the Hunger and Nutrition Fund we launched for Agora for Good’s users.
To improve conversions, we’ll be experimenting with refinements to high traffic pages of our website, using A/B testing (randomly assigning visitors to different versions of our website to see which version performs better) to inform our decision-making. We also plan to improve our donation checkout process, making the user experience of giving on our website a better one. Another key advantage of this checkout project is that it will provide us with a much richer data set about user behavior than we currently have access to, allowing us to identify more opportunities to optimize our website.
Our efforts to increase average donation sizes take two forms. The first is market segmentation: we’re increasingly developing relationships with high net worth groups and individuals capable of making very large donations. Peter Singer’s outstanding reputation and “brand” are invaluable in this area. The other is to optimize the frequency and content of our interactions with our donor base using data from the checkout project.
We have no shortage of work ahead of us in 2016 and beyond. But our efforts are buoyed by the knowledge that this work will ultimately result in better lives for people who are trapped in extreme poverty and need our help. We hope you’ll join us.
[1] The remainder is estimated based on the number of times people clicked a “donate” button for a charity that we are unable to directly track donations. We assume an average $50 per “donate click” (this assumption is consistent with what we see for other charities for whom we can track donations).