2024
Annual Report
TABLE OF CONTENTS
*All dollar ($) amounts specified in this report are United States dollars unless expressly indicated otherwise.
Letter From the Co-CEOs
Philanthropy is changing, and so is the world.
In the past decade, we made remarkable progress in reducing extreme poverty. Between 2008 and 2018, the percentage of people living in extreme poverty dropped from 19 percent to 8.6 percent. But the momentum has stalled. Since 2018, we have seen little progress. In fact, the pandemic reversed gains in many regions, hitting the poorest countries hardest and slowing their recovery the most.
As Bill and Melinda Gates once predicted, the hardest part was still ahead of us.
When we became co-CEOs of The Life You Can Save, we inherited an organization founded by Peter Singer and Charlie Bresler with a bold mission and an even bolder impact. In just over a decade, this organization has raised more than 100 million dollars for high-impact charities. But the value of The Life You Can Save extends far beyond the funds we have directed.
We have helped shape a global movement for effective giving. We have connected donors with exceptional nonprofits working across all dimensions of poverty, including education, health, nutrition, and economic opportunity. We have elevated organizations that would otherwise go underfunded and built a community of thoughtful, committed donors who continue to drive meaningful change for people living in extreme poverty.
As we look ahead, we know that the next decade will require new strategies and greater collaboration. The same approaches that helped lift over a billion people out of poverty between 1990 and 2020 will not be enough to reach those still left behind.
This is why we are evolving.
We are expanding our understanding of what extreme poverty looks like today and how it intersects with issues such as access to health, education, and safety. We are refining our research methods and partnering with other organizations that share our commitment to evidence, impact, and transparency. We are adding new funds and recommended charities to make effective giving even easier for donors around the world. And we are growing our donor community so we can move more resources, more efficiently, to where they are most needed.
2025 began with shockwaves. Foreign aid cuts have shaken the international development sector, putting countless lives at risk. These cuts are already having deadly consequences, and their full impact is yet to be seen.
The changes we began to design and implement last year feel even more urgent now. We believe we are entering a new era of philanthropy. In this new era, people living in the world’s wealthiest countries have both the power and the responsibility to help those who were not born into such opportunity.
We are here to make that possible.
At The Life You Can Save, we will continue to advocate for a world free of extreme poverty. We will continue to spread the word about the power of individual action. And we will continue to offer donors and nonprofit leaders the free tools and trusted information they need to make the greatest possible impact.
In 2024, we raised $20.3 million dollars, an increase of 20 percent from the previous year. We welcomed new team members, continued our growth in Australia and the United States, and launched improvements to our research methodology that will help us better deliver on our mission.
We are proud of the team driving this work forward. They are curious, creative, and unafraid to take bold steps in pursuit of a more just world. We are equally proud of the donors, partners, and community members who make this work possible.
Thank you for being part of this journey.
With gratitude,

Jessica La Mesa and Andrea La Mesa
Co-CEOs, The Life You Can Save

The Year In Numbers
| Metric | 2023 | 2024 | 1 yr % Change | Compound annual growth since 2014 |
| Net Impact | $14,715,288 | $18,511,604 | 26% | 41% |
| Money Moved | $16,941,425 | $20,345,228 | 20% | 38% |
| Expenses | $2,226,137 | $1,833,624 | -18% | 24% |
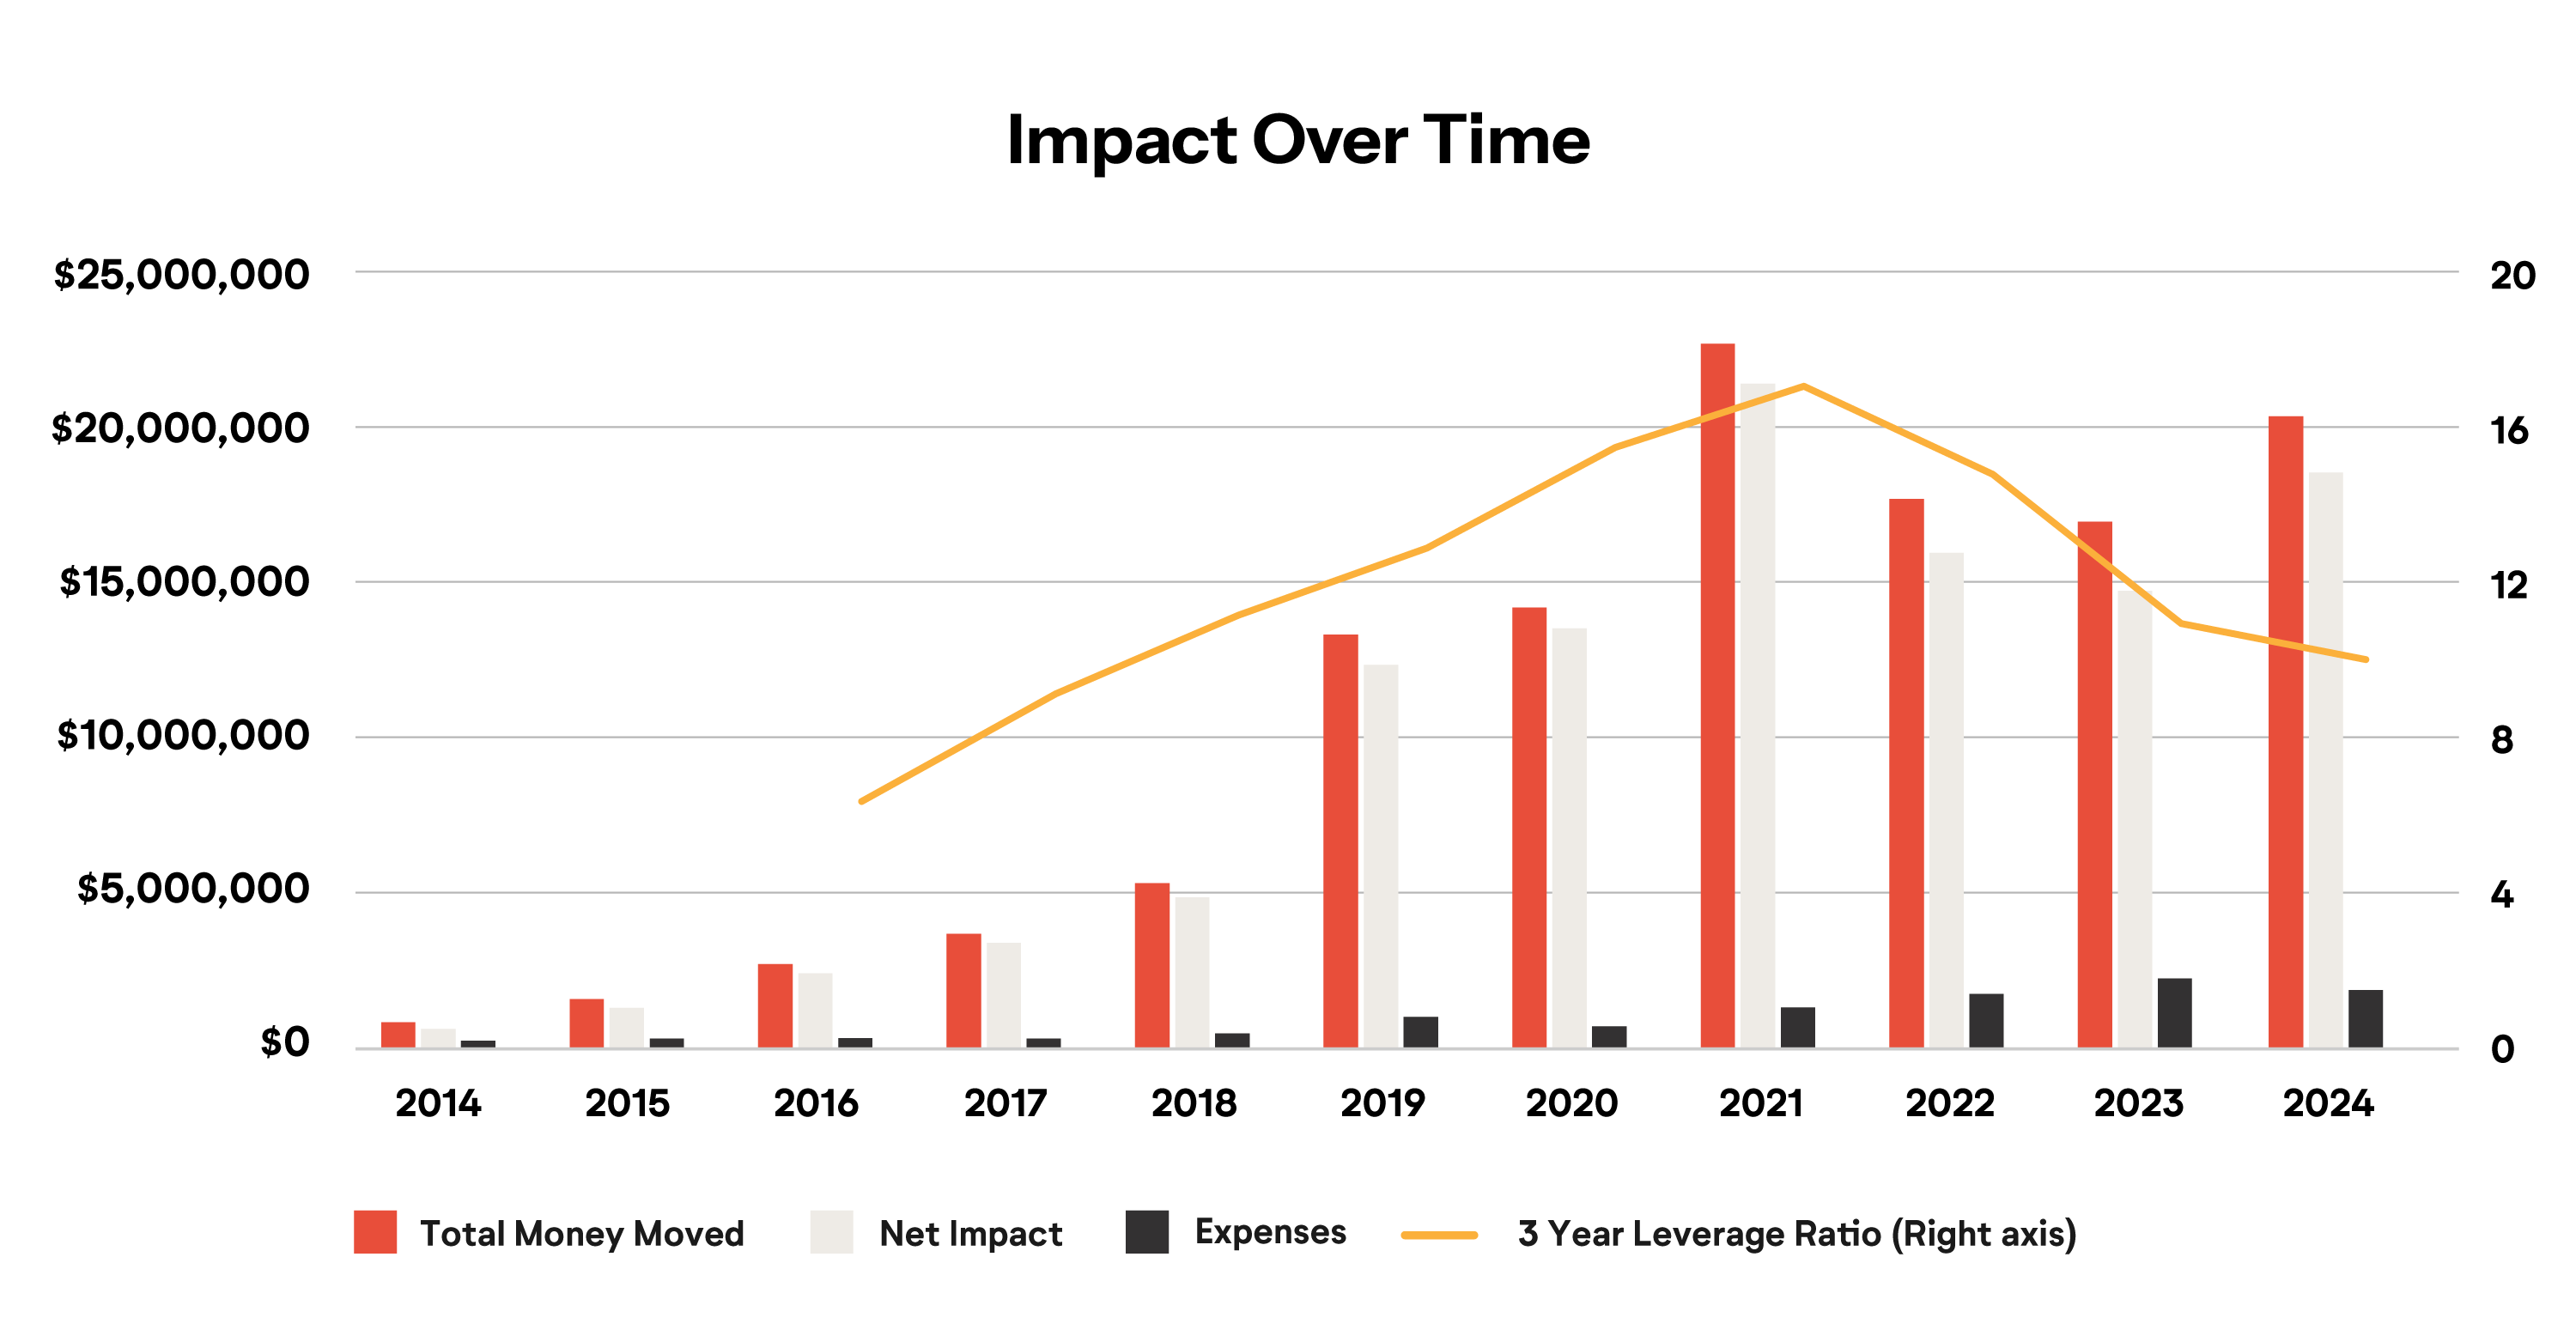
Net Impact: We measure our Net Impact by subtracting our total annual expenses from the total Money Moved to our recommended nonprofits. In 2024, our net impact was ~$18.5 million as we spent ~$1.8 million on our operations globally and raised ~$20.3 million for our recommended nonprofits.
Money Moved: In 2024, our supporters donated a total of ~$20.3 million to our recommended charities.
Expenses: Expenses dropped from $2.2 million in 2023 to $1.8 million in 2024, reflecting an 18 percent year-over-year reduction.
3-year leverage ratio: If you take all the money we raise annually for our nonprofits and divide that number by the money we spend operating our organization, you get what we call our “leverage ratio” for that year. To gauge our impact over time, we rely on a “3-year leverage ratio“ which is simply our average annual leverage ratio over the past three years.
From 2022-2024, our 3-year leverage ratio was 10:1. In other words, for every $1 we invested in spreading our message and helping others discover and donate to effective charities over the last three years, we raised $10 for our recommended nonprofits. We believe our 3-year leverage ratio is a helpful representation of our effectiveness and impact. But we also believe this estimate is fairly conservative since we’re unable to track all the donations that would ideally be included in our overall Money Moved metric.
In 2024 you helped us distribute
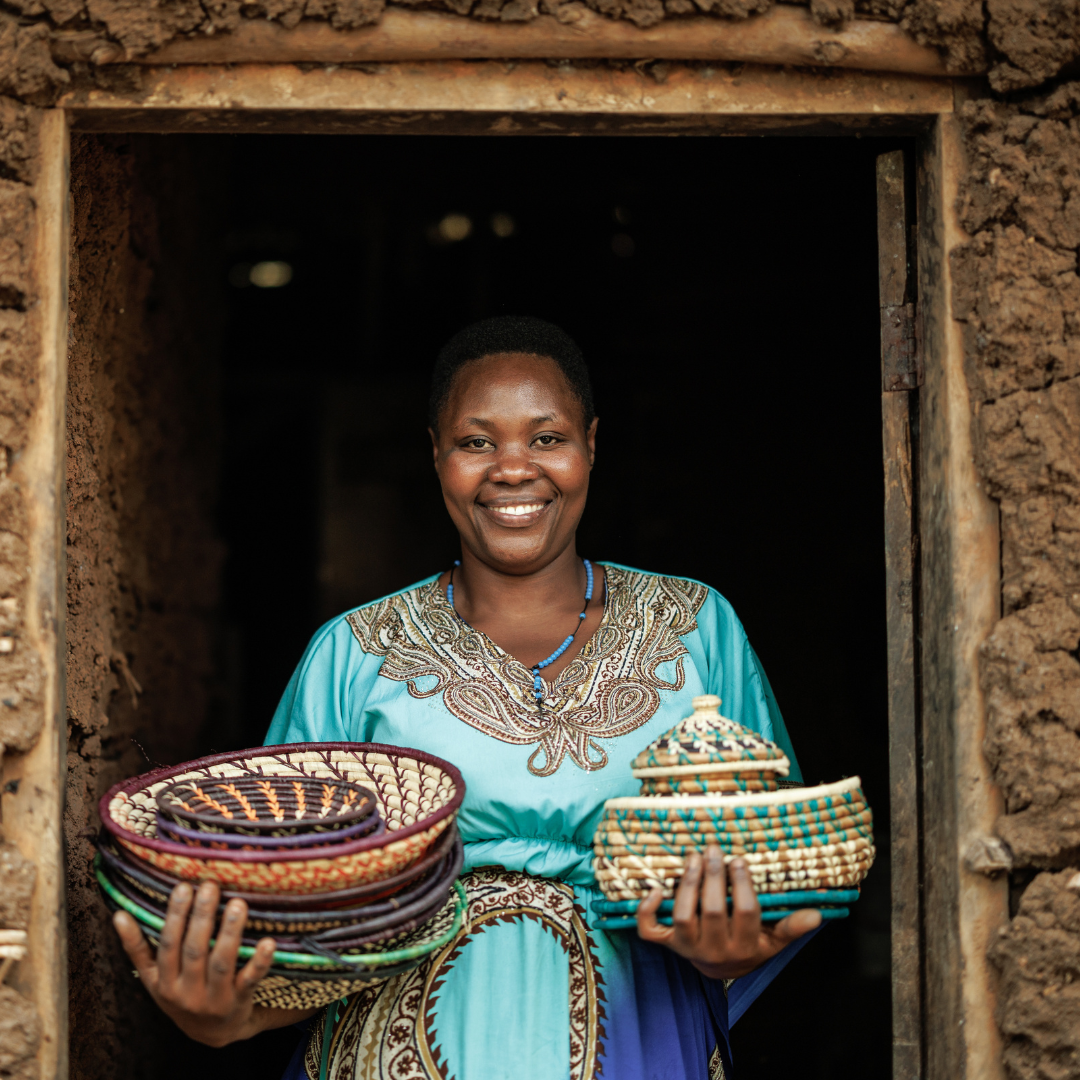
Stories of Changed Lives
Thank you to the 2,627 donors
who helped fund our operations in 2024.
For every $1 dollar we spend on operations, we raise $10 dollars for our recommended charities.
Amplify your giving by donating to The Life You Can Save itself.
Donate to The Life You Can Save
2024 Financials
.
Our Key Metrics: Net Impact and Leverage Ratio
Our key performance metrics are “Net Impact” and “Leverage Ratio.”
Our “Net Impact” takes the money we raise (i.e., our “Money Moved”) and subtracts our operational expenses from that figure. Our “Leverage Ratio,” by comparison, takes our Money Moved and divides that number by our expenses. We typically talk about our Leverage Ratio over a three-year period (money moved over three years divided by expenses over three years) because it can be volatile over a one-year period.
Both metrics compare the amount of money we raise for our nonprofits to the money we spend operating our organization. We believe they are best considered together, but we view Net Impact as the more important single measure because it captures our absolute, real-world impact on the lives of people living in extreme poverty. Our primary goal is therefore to maximise Net Impact while maintaining a reasonable three-year Leverage Ratio.
To illustrate, we would far rather move $100 million to our recommended charities while spending $10 million to do so (Net Impact of $90 million; Leverage Ratio 10:1) than move $100 in total while spending $1 (Net Impact of $99; Leverage Ratio 100:1).
The latter is efficient but achieves little real-world impact. That said, we believe our Leverage Ratio (which we also refer to as our “Multiplier”) is an important metric because it captures the efficiency of our operations.
And we recognize that our Leverage Ratio is an intuitive and meaningful metric for many supporters who donate to fund our operations, one that helps supporters understand the “multiplier” they get on their gift. For instance, by applying our 3-year Leverage Ratio of 10:1 to a gift of $1,000, a donor could expect that donation to help us raise ~$10,000 for our recommended nonprofits.
We believe that both Net Impact and Leverage Ratio are conservative measures of our impact. This is because we know the Money Moved metric used to calculate both metrics doesn’t account for all the donations we may have inspired. While we can measure donations that flow through The Life You Can Save, our ability to track donations that we influence that are made directly to our recommended nonprofits is much more limited. We rely on our nonprofits to track those donations, and many of our nonprofits have limited ability to do so. A donor survey we send out helps fill some, but not all, of the gaps in our data. We’re confident that we’re still missing some donations made directly to our nonprofits. We’re also confident that we’re undercounting donations that we influence where foreign donors give through intermediaries that allow them to claim tax relief.
Even if we could perfectly measure donations made to our recommended nonprofits, our key metrics would still understate our impact. They assign no value to donations that we influence to effective nonprofits that aren’t on our list of recommendations, and they don’t capture non-monetary influence like motivating people to use their careers for social good.
The Life You Can Save Financials 2024
View financial information here.
Money Moved 2024 – What’s Included?
In the ‘Money Moved 2024 – What’s Included’ appendix, we provide a detailed account of our total “Money Moved” (i.e. the total donations to our recommended nonprofits that we either processed directly or influenced) and our operating expenses. We view these figures as a helpful supplement to the standard regulatory reporting measures commonly used to conduct financial analyses of nonprofits (ex. the Form 990 in the US and statements filed with the ACNC in Australia).
Please note that the figures provided in this Annual Report may at times differ from those provided in official financial records for a few reasons:
- Global results vs. National Results: In our Annual Report, we aggregate the money moved and operating expenses of The Life You Can Save (a US-based nonprofit) and The Life You Can Save Australia (which is a registered charity in Australia) in order to assess our overall global impact. Technically speaking, however, “The Life You Can Save (US)” and “The Life You Can Save Australia” are separate legal entities subject to different reporting requirements imposed by their respective jurisdictions. As such, their official records will be separate.
- Revenue for our recommended charities vs. Revenue for The Life You Can Save itself: Our official income statements include two different types of donations we receive: 1) donations given to The Life You Can Save itself for our own operational expenses and 2) donations made through The Life You Can Save and granted by us to one or more of our recommended nonprofits. Our grants are officially recorded as “expenses” and “program costs” in our financial statements in the US and Australia respectively, but to best understand our financial status, it’s important to distinguish between this granting activity and our operational spending.
- Donations processed vs Donations influenced: When calculating our total Money Moved to our recommended charities, we include both donations that we process directly as grants and donations to our charities (either directly or through a third party such as Network for Good or other intermediaries) that our outreach inspired or influenced in some way. Since our official financial statements only record funds directly processed by our own organization, they reflect most, but not all, of our total Money Moved.
For stakeholders interested in reconciling the figures in this Annual Report with those provided in our official financial records, this document offers additional details.
Money Moved 2024 – by Charity
This table offers a snapshot of the Money Moved—amounts raised—for each recommended charity in 2024. It excludes donations from foundations and individuals who have requested that the designation of their contributions remains confidential.

